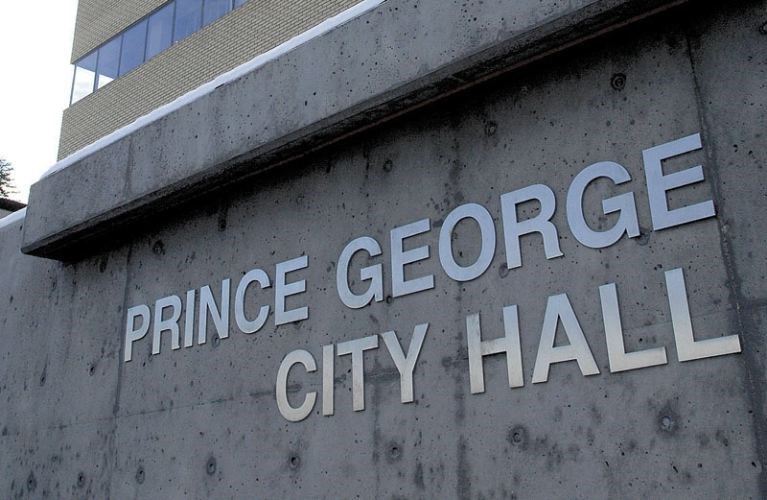
The city's communications officer and others have tried to deflect the criticism about the significant wage hikes received by the city manager and senior administration last year, attributing it to overtime for accommodating the evacuees of the Cariboo wildfires.
Prince George wasn't the only community that took in thousands of individuals. So did Kamloops. Yet the city manager and top staff in that city didn't receive a big boost in pay for doing similar work.
The biggest pay raise a member of the seven-person management team in Kamloops took in 2017 was 3.7 per cent. Two of them saw their income rise by less than 1 per cent.
Meanwhile, the biggest raise among Prince George's nine-person management team in 2017 was 18.5 per cent and the lowest was 5.6 per cent. The city manager and eight of the nine directors saw their pay go up by 9.9 per cent or more in 2017.
In Prince George, the city manager's pay went up 18.5 per cent last year.
In Kamloops, 3.3 per cent.
In Prince George, the community services general manager's pay went up 12.4 per cent last year.
In Kamloops, 0.5 per cent.
In Prince George, the human resources director's pay went up 12.5 per cent last year.
In Kamloops, 3.6 per cent
In Prince George, the finance director's pay went up 10 per cent last year.
In Kamloops, 3.3 per cent
In Prince George, the engineering and public works general manager's pay went up 12.2 per cent last year.
In Kamloops, 1.9 per cent.
In Prince George, the engineering and public works director's pay went up 17 per cent last year.
In Kamloops, 3.7 per cent.
In Prince George, the administrative services general manager's pay went up 9.3 per cent last year.
In Kamloops, 0.6 per cent.
In Prince George, the external relations director's pay went up 12.7 per cent last year.
In Kamloops, 1.7 per cent
In Prince George, the planning and development general manager's pay went up 5.6 per cent in 2017, 11.8 per cent in 2016 and 16.4 per cent in 2015.
In Kamloops, that role is divided among other directors and managers.
The 2017 Statement of Financial Information report from Kamloops notes that pay and taxable benefits includes "Emergency Operations payouts" for work during the wildfires.
Based on their mostly reasonable raises in 2017, it appears that the city manager and directors in Kamloops handled the evacuees as just part of the job required for their generous salaries.
Meanwhile, in Prince George, it appears the city manager and directors were approved salary increases or they all charged overtime for their work accommodating the evacuees (or a combination of the two). Local taxpayers won't know for sure until the 2018 Statement of Financial Information report comes out next June.
The City of Prince George billed the province $4.4 million in salaries and wages for its evacuation efforts so if the city manager and directors all charged overtime, the provincial government will pay for it.
But that's not the point.
There is only one taxpayer, after all.
And how do they justify charging overtime when it appears their salaried counterparts in Kamloops did not?
There's a big difference between hourly employees and the salaried bosses. For those who want to work by the clock, they can stay in those positions but for those who want the big dough, the title and the authority, they take a salary but that means they work until the job is done.
That's the way it's done throughout the private sector and other levels of government, including Kamloops.
The rules seem to be different, however, at the City of Prince George.
They have deep pockets there.
Ours.
2017 senior administration pay increases
City manager
Prince George - $239,983.88 in 2016 and $284,480.31 in 2017, a $44,496.43 (18.5 per cent) increase.
Kamloops - $266,220 in 2016 and $274,883 in 2017, a $8,663 (3.3 per cent increase).
Community services general manager
Prince George - $189,243.33 in 2016 and $212,661.66 in 2017, a $23,418.33 (12.4 per cent) increase.
Kamloops - $206,253 in 2016 and $207,199 in 2017, a $946 (0.5 per cent) increase.
Human resources director
Prince George - $176,382.90 in 2016 and $198,453.95 in 2017, a $22,071.05 (12.5 per cent) increase.
Kamloops - $152,565 in 2016 and $158,127 in 2017, a $5,562 (3.6 per cent) increase.
Finance director
Prince George - $167,292.92 in 2016 and $183,961.96 in 2017, a $16,669.04 (10 per cent) increase.
Kamloops - $185,251 in 2016 and $191,455 in 2017, a $6,204 (3.3 per cent) increase.
Engineering and public works general manager
Prince George - $185,637.48 in 2016 and $208,218.80 in 2017, a $22,581.32 (12.2 per cent) increase.
Kamloops - $198,308 in 2016 and $202,097 in 2017, an increase of $2,789 (1.9 per cent).
Engineering and public works director
Prince George - $173,485.39 in 2016 and $203,007.14 in 2017, a $29,521.75 (17 per cent) increase.
Kamloops - $193,801 in 2016 and $200,963 in 2017, an increase of $7,162 (3.7 per cent).
Administrative services general manager
Prince George - $189,957.46 in 2016 and $207,620.39 in 2017, a $17,662.93 (9.3 per cent) increase.
Kamloops - $204,773 in 2016 and $206,023 in 2017, a $1,250 (0.6 per cent) increase.
External relations director
Prince George - $177,124.17 in 2016 and $199,911.34 in 2017, a $22,787.17 (12.7 per cent) increase.
Kamloops - $124,024 in 2016 and $126,166 in 2017 , a $2,142 (1.7 per cent) increase.
Prince George planning and development general manager
- $210,299.66 in 2017, a $11,143.32 (5.6 per cent) increase
- $199,156.34 in 2016, a $21,095.74 (11.8 per cent) increase.
- $178,060.60 in 2015, a $25,090.02 (16.4 per cent) increase.
- $152.970.58 in 2014


