
Want to know how much crime there is in your neighbourhood? An online map hosted by the City of Prince George shows the location of every property crime reported to the Prince George RCMP, starting in January 2021.
The data can be viewed in a timelapse video or in a month-by-month breakdown. Between April 1 and June 11 (the most recent monthly data available), there were 1,032 property crimes reported in Prince George.
The city averaged more than 14 property crimes reported per day over the 72-day period. Property crimes not reported to police are not represented in the data. According to Statistics Canada’s General Social Survey on Canadians’ Safety (Victimization) from 2019, only about 29 per cent crimes are reported to police.
The property crimes reported during that period include:
126 break-and-enters
31 vehicles stolen (including 18 valued over $5,000)
34 bikes stolen (including two valued over $5,000)
200 thefts from vehicles (including three thefts greater than $5,000)
335 other thefts (including six valued over $5,000)
306 reports of mischief, such as vandalism or otherwise damaging property or obstructing its lawful use (including three counts where the damages were over $5,000)
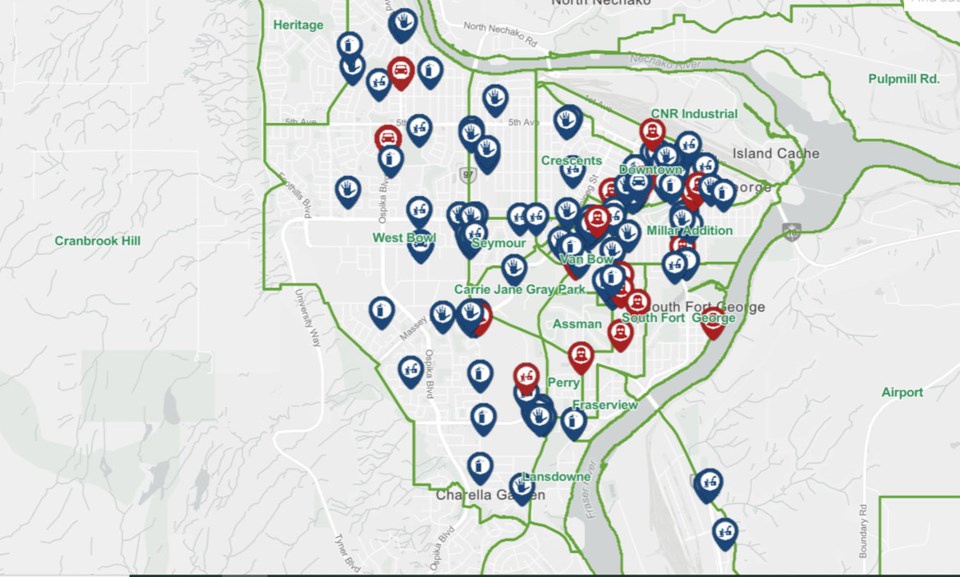
Between June 1 and June 11, there were 154 property crimes reported to police. Of those:
38 were in the west bowl and Cranbrook Hill (West Bowl, Heritage and Cranbrook Hill)
35 were downtown (downtown and the CNR Industrial Site)
35 were in the south bowl (Millar Addition, VLA, Van Bow, Assman, Perry, South Fort George, Fraserview and Lansdowne)
19 were in the east bowl (Crescents, East Central Fort George, Seymour and Carrie Jane Grey Park)
10 were in College Heights and the Southwest (including the Vanway area).
10 were in the Hart and North Nechako (North Nechako, Pulpmill Road, Hart Highlands, Central Hart, Austin West, Austin East, Chief Lake and Old Summit Lake areas.)
Seven were in the east side of the city (BCR Industrial Park, Danson Industrial Park, airport area and Blackburn)
In general, crime was most concentrated downtown and in the bowl areas - especially in areas with retail services - and lower in the areas outside the bowl.


